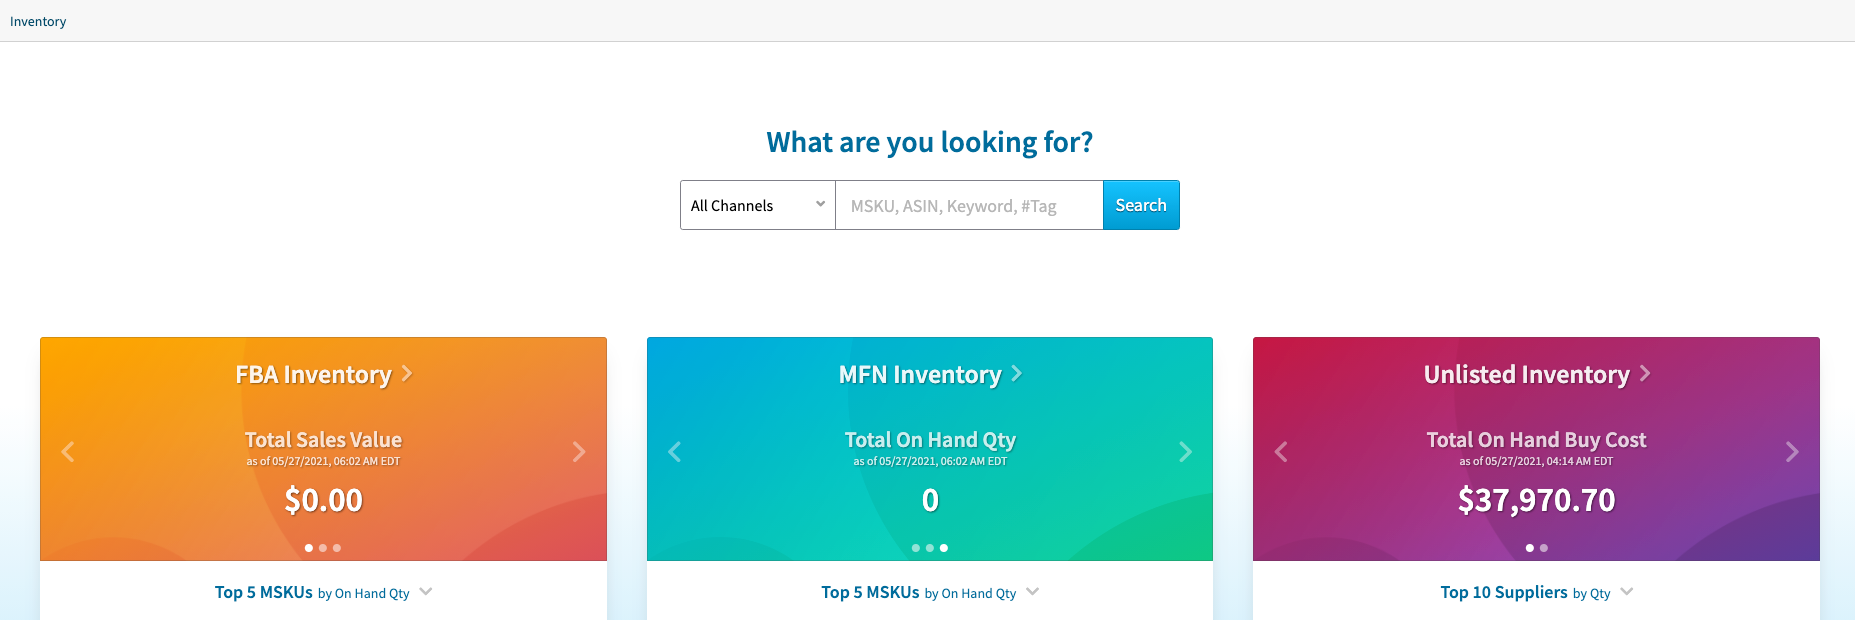
The Inventory Overview page gives you an at-a-glance view of FBA, MFN, and Unlisted Inventory details in the form of widgets, and allows you to search for items amongst all of your inventory channels.
To view your Inventory Overview page, click the Inventory tab and select Inventory Overview from the dropdown menu.
Searching Your Inventory
Looking for a specific item or group of items? The Search feature allows you to look up any item by MSKU, ASIN, Keyword, or Tag.
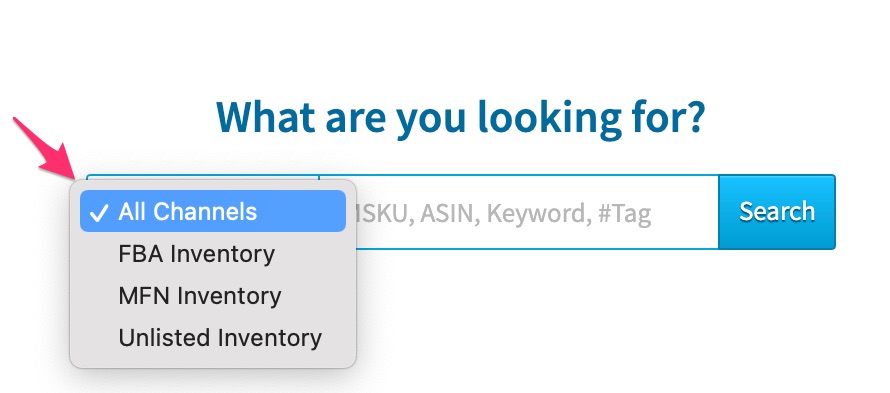
You can search all inventory channels at once or select one channel.
When searching All Channels, you will see the On Hand quantity of each item in a channel, as well as if the item is in Archived Inventory.
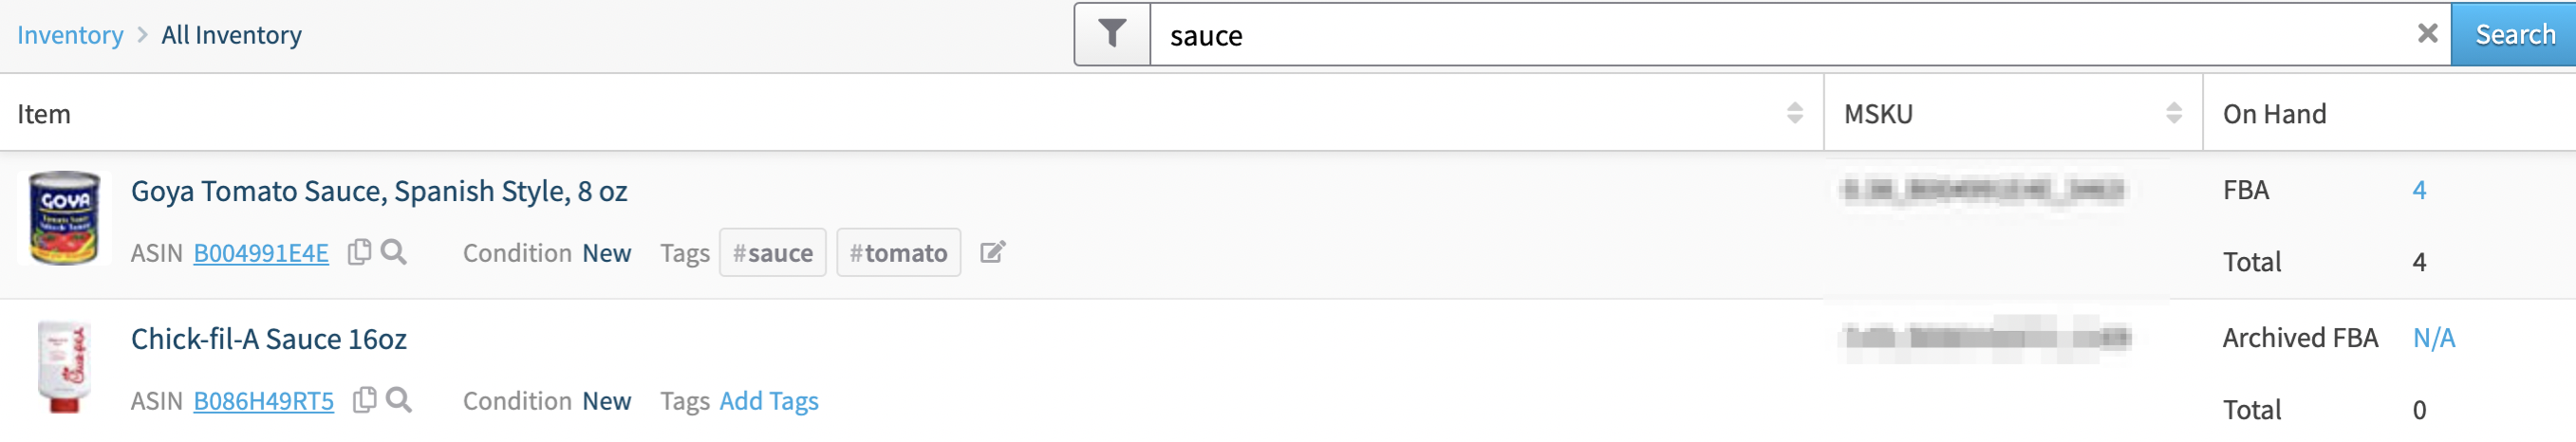
Clicking the on-hand quantity shown for a channel will bring you to the channel's Item Details page, where you can view and edit purchase details such as cost/unit, supplier, and purchase date.
Clicking the on-hand quantity shown for a channel will bring you to the channel's Item Details page, where you can view and edit purchase details such as cost/unit, supplier, and purchase date.
To select a specific inventory channel, click the All Channels dropdown:
Inventory Data Widgets
Each widget is updated daily and includes a timestamp of the last update within each (in local time).
To open the main Inventory page for each channel, click the arrow next to each widget header.

To modify the data you'd like to see, use the available arrows within each widget. Daily totals are available by clicking the arrows to the right or left.

Clicking through the arrows shows the following data:
- Total Sales Value - A calculation of the on-hand totals multiplied by the List Price of an MSKU. Each total is added up for each MSKU to create the sum of the Total Sales Value. (This is available for FBA and MFN only.)
- Total On Hand Buy Cost - Total cost/unit for all Active MSKUs at the time of the sync.
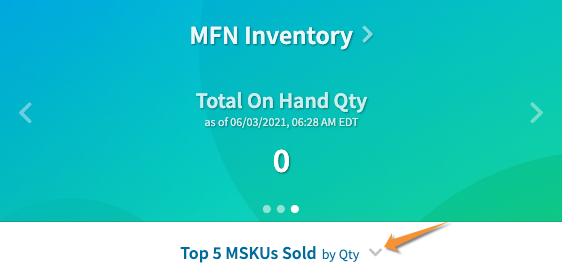
- Total On Hand Qty - Total on-hand quantity for all Active MSKUs at the time of the sync.
You can see how well your items are doing by checking the stats within each widget.
The following data can be viewed by clicking the arrow in the lower section of each widget.
- Top 5 MSKUs by On Hand Qty
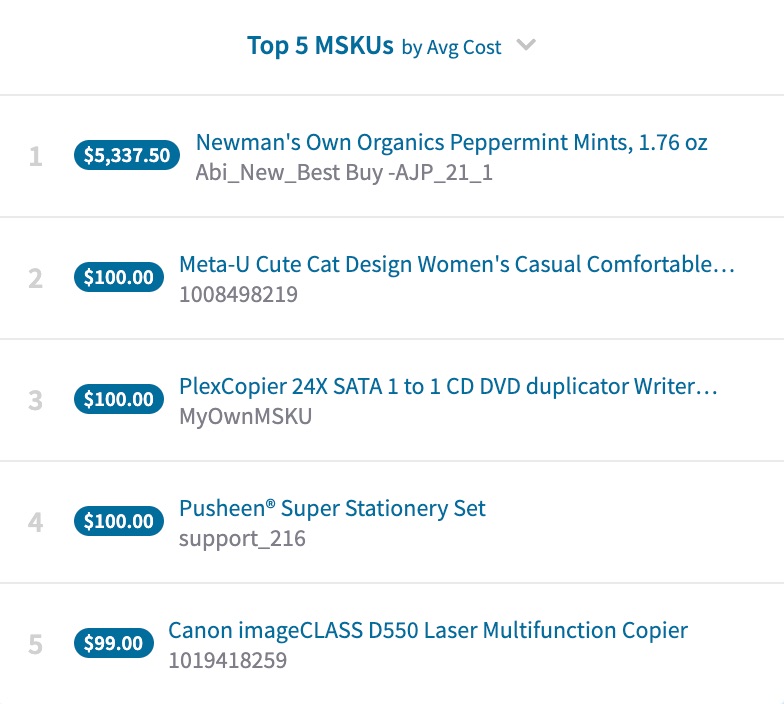
- Top 5 MSKUs by Avg Cost
- Bottom 5 MSKUs by Avg Cost
- Top 10 Suppliers by Qty
- Top 5 MSKUs Sold by Qty (Available for FBA and MFN only)
- Top 5 Replenished MSKUs
- Top 5 MSKUs by Sales Value (Available for FBA and MFN only)